In the last post from the Job Stability Committee, we discussed how job stability is an equity issue. While this is true for all Unit 2 members, social location also plays a role in how members experience job stability – or lack thereof. Below, we discuss the challenges in assessing whether our workplace is equitable, given a lack of data.
There are many ways members’ lived realities can impact their experience of job stability. Consider the following examples. When members with disabilities apply for workplace accommodations, is the process smooth and helpful, or onerous, exhausting, and invasive? Can racialized members find mentorship and support when they face microaggressions and workplace violence? Does the Employer address gender-based violence in a meaningful and timely manner when it arises in the workplace? These are important considerations for retention, and affect who gets to accrue enough experience and seniority to access the kind of pseudo-stability offered by higher seniority and certain long-service programs.
Unfortunately, the data the union has on the composition of Unit 2 is patchy at best. Despite successfully negotiating better equity data in the previous bargaining round, the employer has yet to fully produce it. The Job Stability Committee is also still waiting for further data that it requested from the employer months ago.
Here’s what we know: in the last round of bargaining, the employer refused everything but the bare-minimum of representation using the thresholds in the Federal Contractors Program (FCP). In the context of the Job Stability Committee, the employer provided some data that asserts that they are meeting these representation thresholds. However, when we took a deeper look into the data, it was revealed that the employer is not meeting their own representation thresholds. For example, the employer’s claim is that 34% of Unit 2 members identify as racialized, and based on this claim, that the FCP threshold (30.9%) has been met. Yet, when comparing the number of members who identify as racialized to the entire membership of Unit 2 – rather than simply to the number of members who completed a self-ID survey in 2020 – we see that actually only 24% of Unit 2 members self-identify as racialized people. For context, 52% of the population of Toronto is racialized.
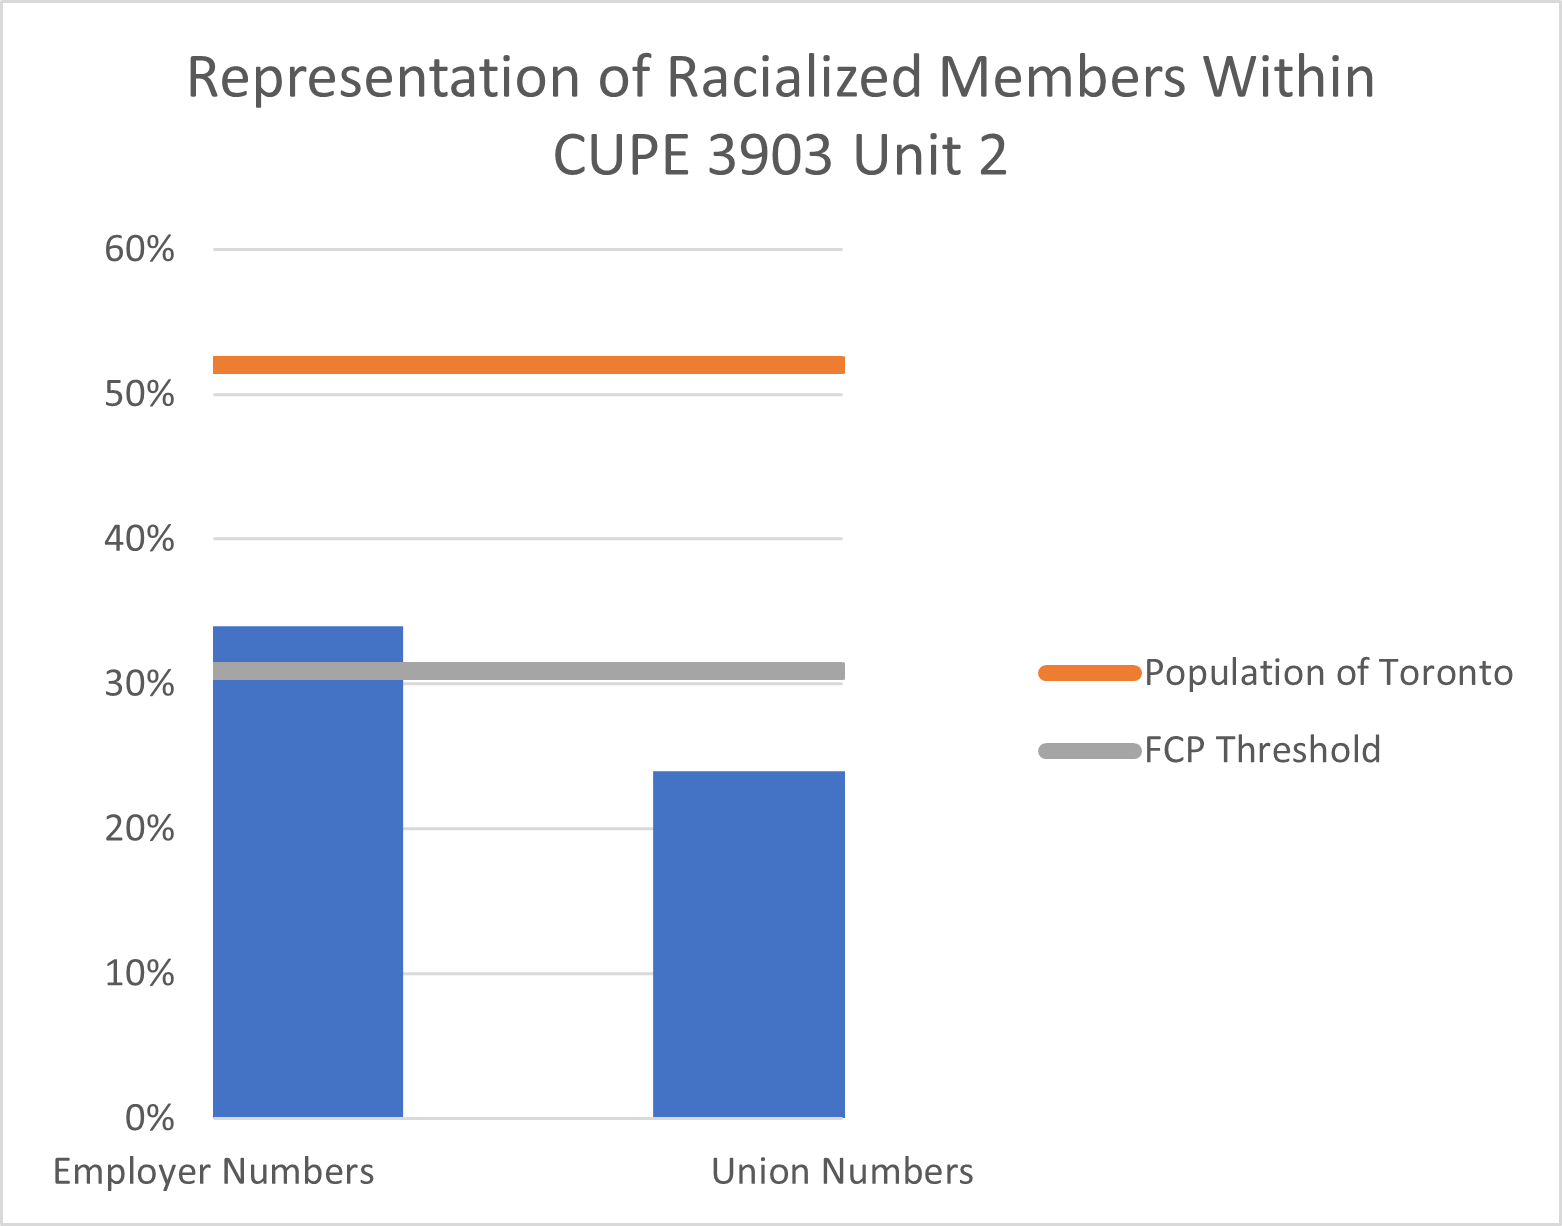
Of course, we cannot know how those who did not fill out the survey identify. The true numbers most likely lie somewhere between the employer and the union numbers. It is the employer’s responsibility to get this data, and it has been a struggle to get them to consistently send out self-ID surveys to the correct email addresses, compounding this problem. In the end, one thing is for sure: the employer’s numbers are inflated.
This problem with the existing data on representation points to a sizable challenge facing the Job Stability Joint Committee (JSJC): in order for any programs to be successful and equitable, they must address how the Employer’s current hiring and retention practices continue to fall below the already very low thresholds for representation of equity-seeking groups.
Don’t Forget: Respond to Job Stability Survey!
It’s your last chance to fill out the Job Stability Survey! You have until May 15th to help the union gain a fuller picture of what the membership wants and needs. This information will inform the work of the JSJC and also the next round of bargaining, which is just around the corner (starting summer 2023).